Waveform Graph/FFT
- Ideal when reviewing waveforms while investigating the cause of a power supply problem.
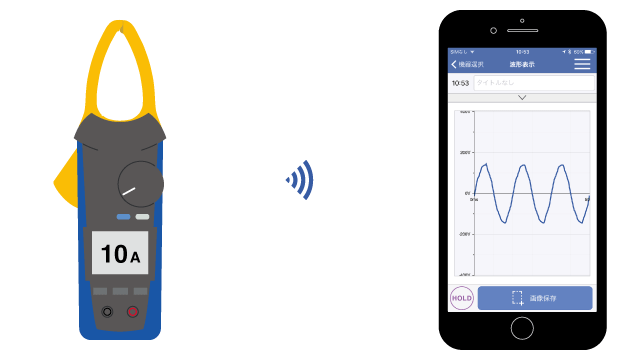
- Display waveforms like an oscilloscope.
- Display motor starting current waveforms.
Example uses

Features
That problem... It may be caused by a distorted waveform, even if the measured values are normal.
Waveforms can be distorted, even if measured values are normal. Distorted waveforms sometimes cause electric devices to malfunction.
By measuring waveforms instead of making judgments based on measured values alone, you can realize higher-quality measurement.
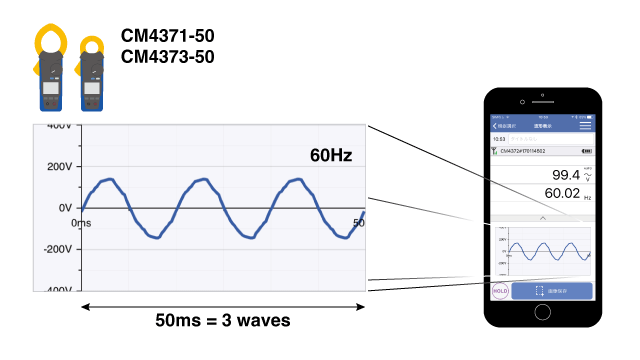
Measurable waveform frequencies and measurement time vary by instrument. For example, if you measure a 60 Hz sine wave using the CM4371-50 or CM4373-50, the app will display a waveform covering 3 cycles.
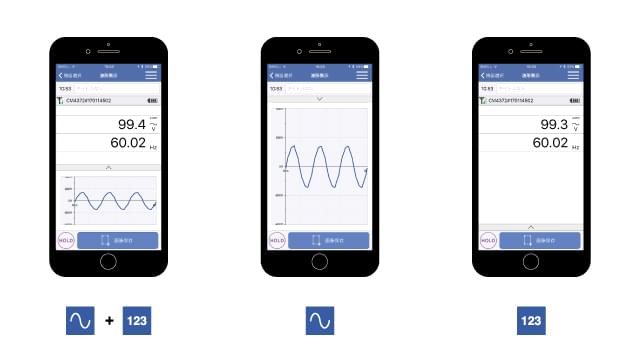
Freedom for waveform operations
The display can be switched among three modes: simultaneous measured value and waveform display, waveform display, and measured value display.
The display is refreshed at an interval of approximately 1 s.
You can pinch in and out on the waveform to zoom in and out.

FFT conversion: See how distorted a waveform is.
You can perform FFT conversion on measured waveforms so that you can view individual frequency components.
You can also display total harmonic distortion (THD) and crest factor (CF).
*This simplified FFT conversion process does not take calculation error into account.

There’s also a harmonic analysis function in case you wish to review harmonics more closely. You can also acquire logging data for harmonic components.
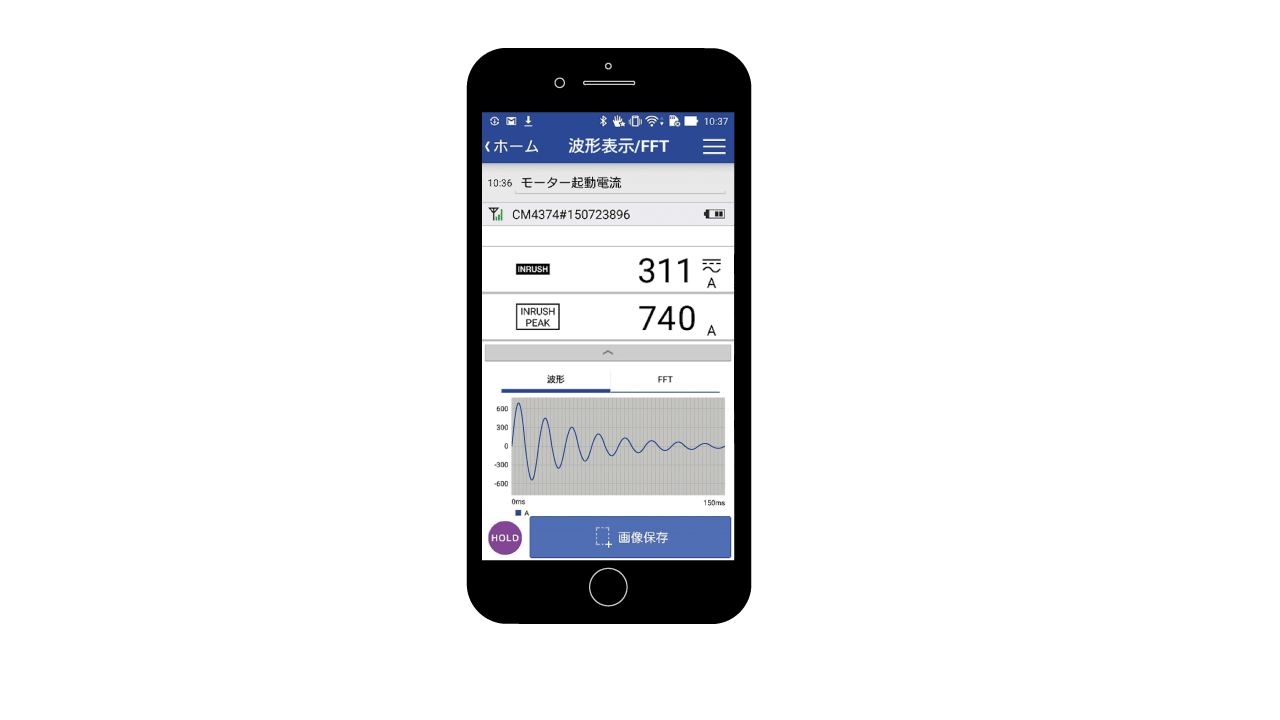
Checking motor starting current waveforms
Using an instrument that has an INRUSH (inrush current) function, you can measure a motor’s starting current.
You can then review that waveform using GENNCT Cross.
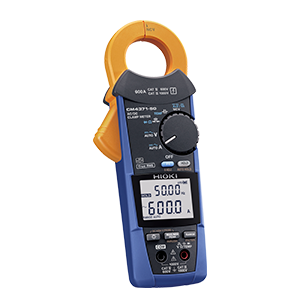
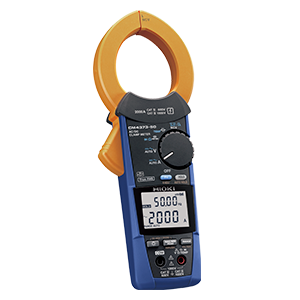
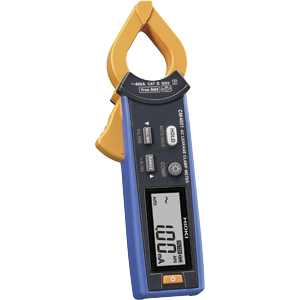
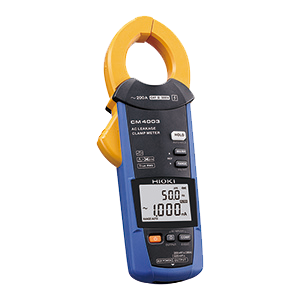
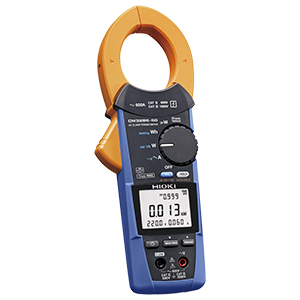
AC/DC Clamp Meter CM4371-50, CM4372, CM4373-50, CM4374, CM4375-50, or CM4376 AC Clamp Meter CM4141-50, CM4142 AC Leakage Clamp Meter CM4002 or CM4003
Two waveforms measured using the in-rush current function can be saved in the instrument’s memory, and those waveforms can be displayed by GENNECT Cross.
** AC Leakage Clamp Meter CM4001**
Functionality is not available for saving data on the instrument. While the instrument is waiting for an inrush current, GENNECT Cross will be in standby mode and will not display a waveform. When an inrush current is measured, that waveform will be displayed.
Instructions
Specifications
| No. of instrument connections | 1 |
|---|---|
| Waveform display, measured values, FFT display |
|
| Sampling frequency, sampling time | Varies by instrument. |
| Inrush waveform acquisition | Acquires the inrush waveform saved on the instrument. |
THD display | Calculates THD based on the FFT results.
|
| CF display (crest factor) | Calculates CF from the measurement waveform.
|
Supported instruments