Event Recording
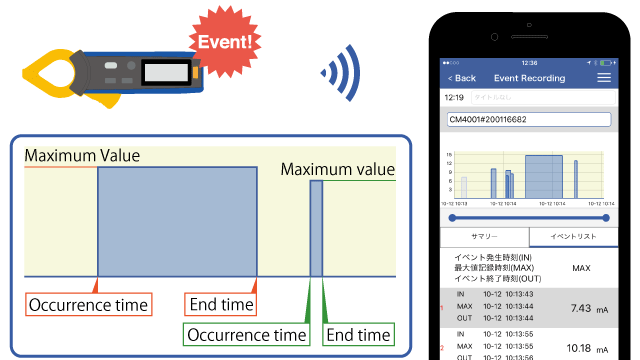
- If the software detects an anomaly by comparing measured values with threshold values, it determines that an event has occurred.
The time of the event, stop time, and maximum value during that interval are recorded for each event. - Recorded data from events occurring on up to 16 instruments can be displayed on a time-series graph.
- Ideal for recording leakage current events.

Example uses
Page links are generated automatically once a page has been created.
- Investigating the cause of intermittent electrical leaks
- Investigating power consumption
Features
The time and nature of events are obvious.
The software detects anomalies by comparing measured values with threshold values that have been set in advance.
When an anomaly occurs, the time of the event, stop time, and maximum measured value can be displayed on a graph.
The graph indicates which events occurred, and when.
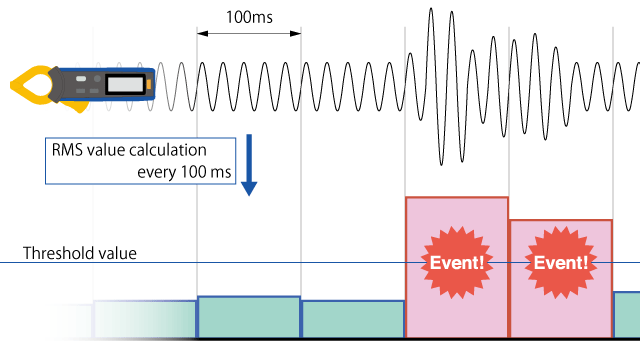
Ensuring short-term changes are captured
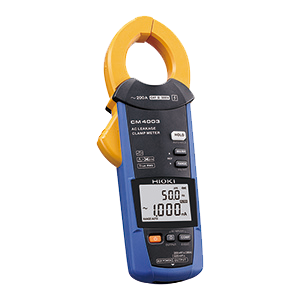
This section describes the AC Leak Clamp Meter CM4001.
The CM4001 calculates RMS values for waveforms every 100 ms (5 wavelengths at 50 Hz or 6 wavelengths at 60 Hz).
Every 100 ms, it compares those RMS values and threshold values to detect events without any temporal gaps.
As a result, you can record shot-term changes like intermittent electrical leaks without missing anything.
The event recording function records events at a minimum time unit of 1 second, instead of every 100 ms.
That is, if any event is detected from the ten rms values in the 1 second, the 1 second is recorded as the duration in which the event occurred.
If the next 1s has a series of events, it counts as one event.
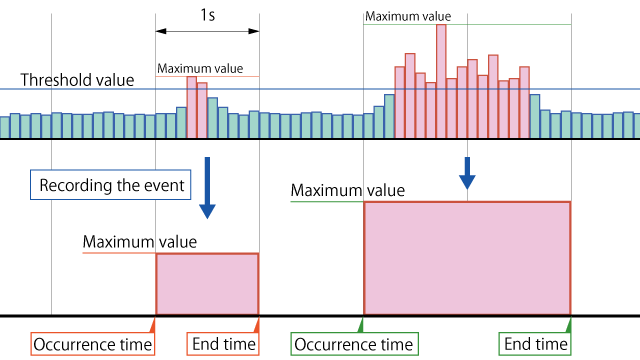
For a single event, the following items are recorded.
- Event occurrence time
- Event end time
- The maximum value of the event duration (the maximum value of the rms value every 100 ms)
Investigating the cause of an event by comparing event recording data from multiple instruments
You can combine event data recorded in multiple locations and display it as a graph.
If events occur in multiple locations at the same time, they are likely correlated.
You can compare event recording data from up to 16 instruments.
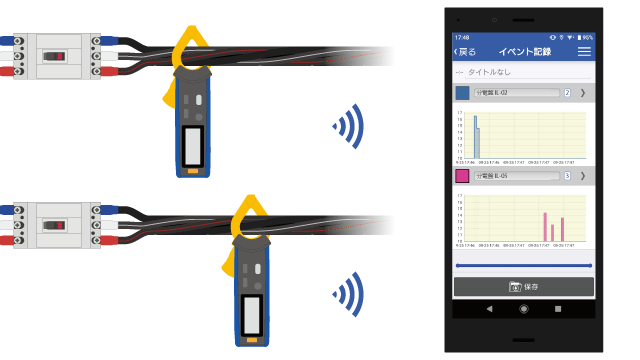
If you’re looking for an intermittent electrical leak, install leakage clamp meters at distribution breakers and branch breakers to record events. By displaying the event data recorded by each current clamp meter as a graph, you can investigate the path of the leakage current.
There’s no need to leave your smartphone in the field while recording data.
Since instruments operate on a standalone basis while recording data, there’s no need for them to connect to GENNECT Cross.
Once recording ends, data is collected and sent to GENNECT Cross.
This feature provides the following benefits:
- When performing measurement for an extended period of time, there’s no need to leave your smartphone or tablet in the field with the instrument.
- You can summarize data on a single graph, even if measurement locations are far away.
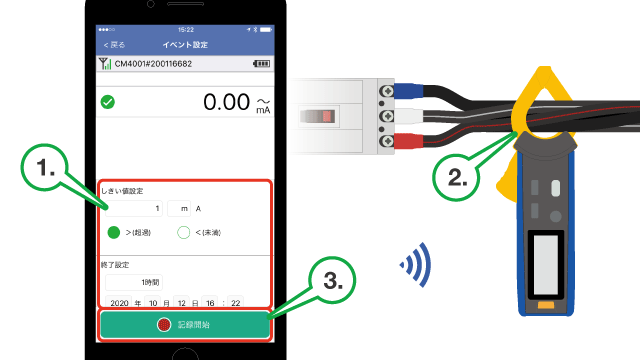
Simple operation
To use the event recording function :
- Setting threshold value and recording times in GENNECT Cross
- Install a measuring instrument
- Tap the Start Recording button on GENNECT Cross to start recording.
- It is not necessary to connect the instrument to the GENNECT Cross during measurement.
- If the instrument detects an event, its LCD will turn red.
- Once the recording is complete, reconnect the instrument to GENNECT Cross and collect the recorded data.
Operation
Specifications
| Number of simultaneous instrument connections | 1 |
|---|---|
| Recording settings |
|
| Importing data | Loading all event data on an instrument |
| Event details display |
|
Supported instruments