Monitor function
The monitor function can display GENNECT polled data collected every minute in real time.
Measured values from GENNECT One, and Cross connected to GENNECT Cloud can be selected as GENNECT polled data.
GENNECT polled data is stored on a cloud server.

| Recording interval | Fixed at 1 min. |
|---|---|
| Display updates | 1 min. |
| Using data |
|
GENNECT polled data
Selecting GENNECT polled channels
Measured values from GENNECT One, and Cross connected to GENNECT Cloud can be selected as GENNECT polled data.
| Select from GENNECT One | Using remote measurement mode
|
|---|---|
| Select from GENNECT Cross | Using the cloud monitor function |
How to register GENNECT polled data
- The gateway will query each instrument and collect measured values registered as GENNECT polled channels every minute.
- The gateway will send the GENNECT polled data to a cloud server.
- The GENNECT polled data will be stored on the cloud server.
- The most recent GENNECT polled data can be viewed on the monitor function screen.
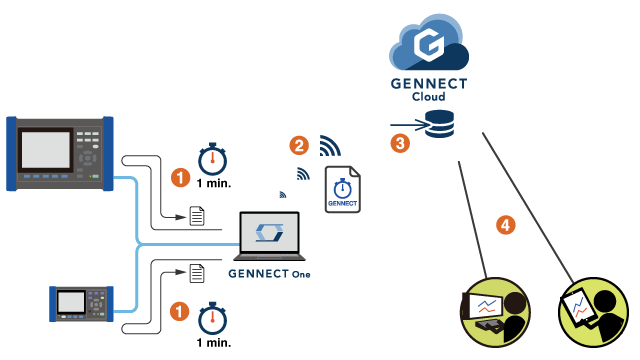
*This diagram illustrates the registration method for GENNECT One. Similar processes are used for GENNECT Cross.
Calculation channels
The channel calculation function performs calculations using GENNECT polled data and registers the calculation results as a calculation channel. Calculation channels are registered, and their display is updated, along with GENNECT polled channels to the cloud server every minute.
Potential uses include the following:
- Converting a sensor’s electrical signals into physical properties
- Adding together energy values for multiple distribution panels
- Converting energy values to
| Operators and functions available for use | Four arithmetic operations (addition, subtraction, multiplication, division), square, square root |
|---|---|
| Channels used in calculation |
|
| Number of channels that can be used in calculations | 10 channels per equation |
Issuing notifications immediately in the event of anomalous measured values
You can detect anomalous values by setting thresholds for channels using the alarm function.
When an anomalous value is detected, a notification is immediately issued via email, LINE, Slack, Microsoft Teams, or GENNECT Cross.
Displaying graphs using the time-series viewer
GENNECT polled data refers to measured data acquired from a variety of instruments.
The time-series viewer function can aggregate the resulting diverse range of measurement data into a single graph.
Past data stored on the cloud server can be easily displayed as a graph in order to assess fluctuations in measured values.
| Number of calculation channels that can be selected | Up to 32 |
|---|---|
| Period | 1 hr. (automatic display updates) / 1 day / 1 week / 1 month / 1 year / user-defined period |
| Aggregating data |
|
Exporting data for additional analysis
GENNECT polled data can be exported in the CSV format to allow analysis using Excel or other software.
| Export formats |
|
|---|---|
| Number of calculation channels that can be selected | Up to 32 |
| Selection period | Up to 1 year |