Logging (Recording)
- Display a graph of changes such as fluctuations in load current.
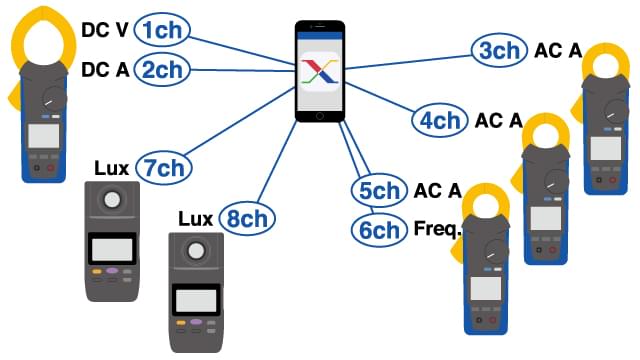
- Log up to 8 channels simultaneously.
- Log measured values at an interval as short as 1 s.
- Display the average, maximum, and minimum values for logging data.

Example uses
Features
Recording and displaying a graph of variations
When dealing with fluctuations, for example in a load current, it’s difficult to follow the instrument’s display with your eyes. Measured values change from moment to moment, and the next measured value will be displayed while you’re reading the current one. You may end up with an erroneous measurement, for example because you miss the maximum value.
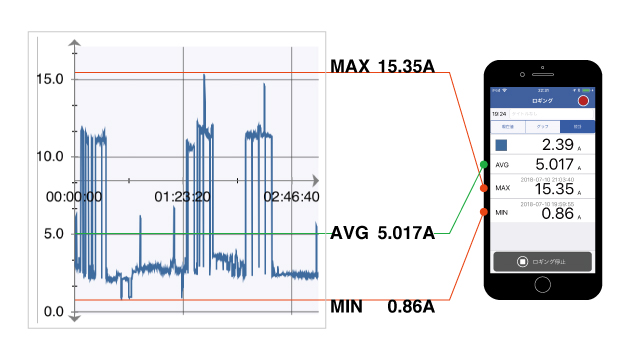
You can record measured values at a set interval and graph them immediately. You can look back over past data, and you can check average, maximum, and minimum values.
In this way, the logging function lets you record changes and check past data.
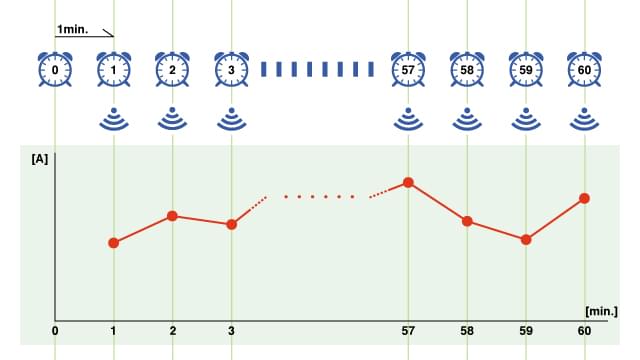
For example, assume you set the logging interval to 1 min. and the logging continuous time to 60 min., and then start measurement. The app will log data for 60 min. at a 1 min. interval, which is to say, it will automatically save 60 measurement data points and display them on a graph.
You can tap a button to stop logging while it’s in progress.
*Exercise care concerning remaining instrument battery life when using the logging function for an extended period of time. Measurement will stop if an instrument runs out of battery while logging is in progress.
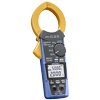
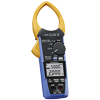
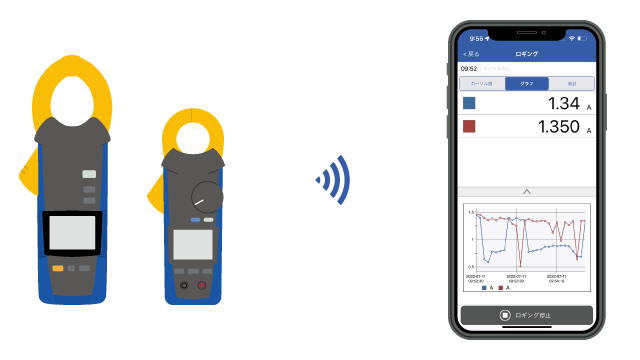
The app also allows you to measure multiple locations. Log up to eight channels at once.
For example, you can simultaneously measure fluctuations in load current at multiple locations.
Log up to eight channels at once and aggregate the data into a single graph.
The number of channels is determined by the number of measured parameters, not the number of instruments. For example, if a clamp meter is being used to measure current and frequency, that would constitute two channels of data.
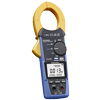
Record faster changes. Use a recording interval as short as 1 s.
Although the minimum logging interval when logging multiple channels is 5 sec., you can set an interval as short as 1 sec. when measuring a single channel.
This capability is useful when you wish to record faster variations.
Finding average, maximum, and minimum values
You can display the average, maximum, and minimum values up to the time of the current measured value since you started logging.
For maximum and minimum values, the time and date at which each value was measured are also shown.

Operation
Specifications
| Maximum number of simultaneous instrument connections | 8 |
|---|---|
| Maximum number of channels | 8 channels |
| Logging |
|
| Logging interval | 1 s to 24 hr.
|
| Logging continuous time | 1 s to 24 hr. |
| Display methods |
|
| Other | The instrument’s APS (auto power off) function is disabled during logging. |
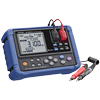
Supported instruments