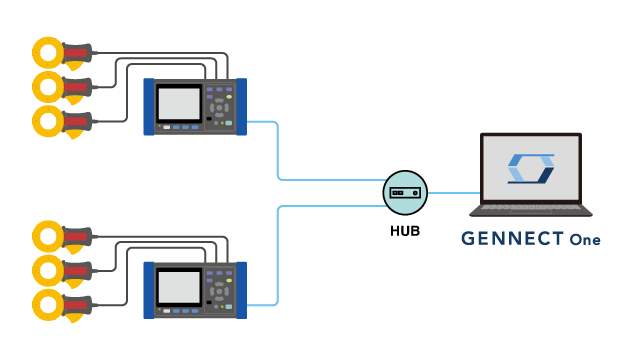
Logging (LAN-connected instruments)
- Take advantage of LAN speeds to log up to 512 channels at an interval as short as 1 s.
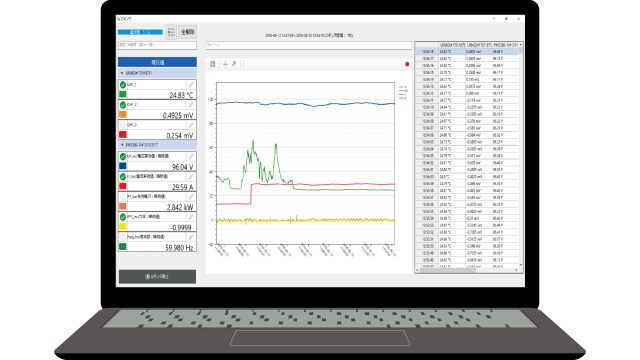
- Display of the latest values is updated in real time (up to 32 channels).
- Automatically output CSV files and daily/weekly/monthly reports.
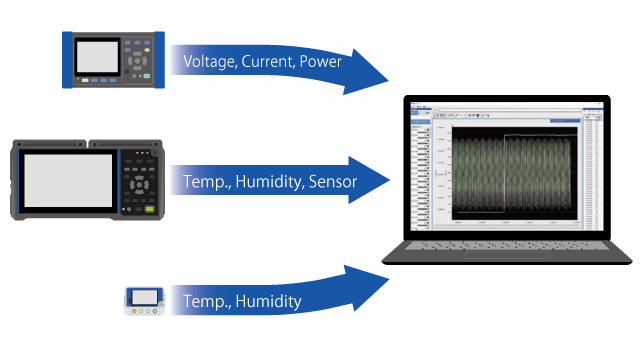
Example uses

Features
This function lets you acquire measured values from LAN-connected instruments and monitor them (numerically) in real time or display them as a graph.
Log up to 512 channels at an interval as short as 1 s.
Functionality for searching for instruments on your LAN makes it easy to connect.
Select the channels to log from connected instruments.
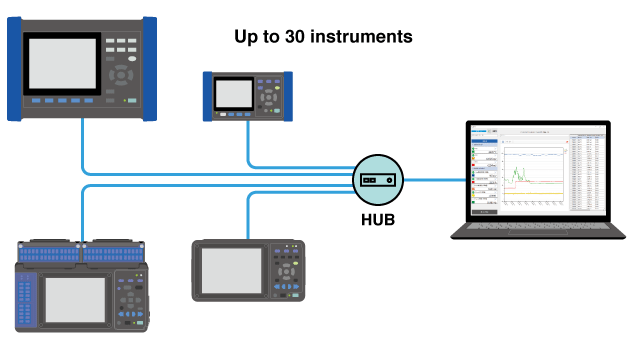
| Maximum number of connected instruments | 30 instruments |
|---|---|
| Maximum number of channels | 512 channels + 16 channels (inter-channel calculation channels) |
| Logging Interval | 1 / 2 / 5 / 10 / 30 s, 1 / 2 / 5 / 10 / 30 min, 1 hour |
Select up to 32 measurement channels for inclusion on monitor and graph displays.
Display of these values is updated in real time.
Performs calculations using measured values. The results are logged.
Calculations are performed using measured values, and the results are logged.
Example uses
- Converting sensor input into a physical property
- Totaling energy values for individual branch circuits
| Numerical value | Channels or constants |
|---|---|
| Basic arithmetic operations | , , , , brackets |
| Basic operation | Absolute value, square root, cube root, power |
| Trigonometric function | , , , , , |
| Exponential functions, logarithmic functions | , , |
| Rounding | Round up, down, or round to the specified number of digits |
Automatically outputting CSV files and daily/weekly/monthly reports
Logging values can be automatically output as a CSV file on a regular basis or output as a daily, weekly, or monthly Excel report.
Automatic CSV output
Outputs detailed information, statistical values, and measured values for all channels on a daily or hourly basis. The file format is CSV format.
| Output contents | Description |
|---|---|
| Channel Information | Instrument, serial number, channel name, measurement start time, stop time |
| Statistics | The average/maximum/minimum value of each channel during the period from the start of measurement to the stop. |
| Measured value | All logged measurements |
Automatic Report Output
The measurement data is totaled and automatically output as a daily / a weekly / a monthly report in the pre-defined report format. The file format is PDF or Excel.
| Report contents | Description | |
|---|---|---|
| Instrument information | List of measuring instruments | |
| Channel Information | Detailed channel information | |
| Measurement data | List | Table of average / maximum / minimum values for each channel at time intervals (). |
| Graph | Graph of measurement data list. | |
| Demand list | Tables totaling each channel, effective electric energy, electricity rates, and CO2 equivalent | |
Specifications
| Maximum number of instruments | 30 instruments |
|---|---|
| Maximum number of channels | 512 channels + 16 channels |
| Logging |
|
Logging Interval | 1 / 2 / 5 / 10 / 30 s, 1 / 2 / 5 / 10 / 30 min, 1 hour |
Monitor Interval | 1 / 2 / 5 / 10 / 30 s, 1 / 2 / 5 / 10 / 30 min, 1 hour |
| Logging continuous time | 2 s to 30 day 23 hr. 59 min. 59 s |
| Data segmentation | 1day / 1hour |
| Maximum number of channels in graph display/list display | 32 channels |
| Chanel calculations | Calculations using a measured value from at least one measurement channel |
| Automatic output | a daily / a weekly / a monthly report, CSV |
| instrument search | Search for and connect to instruments on the same network. |
GENNECT One Supported instruments