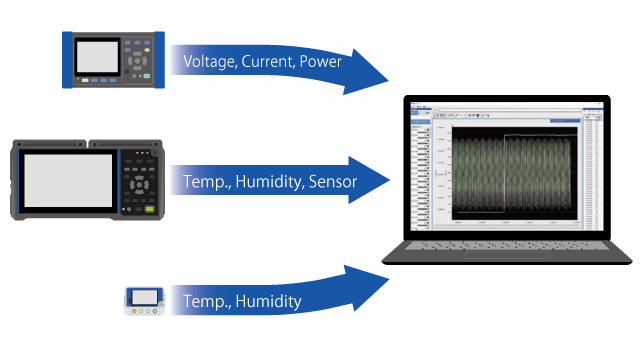
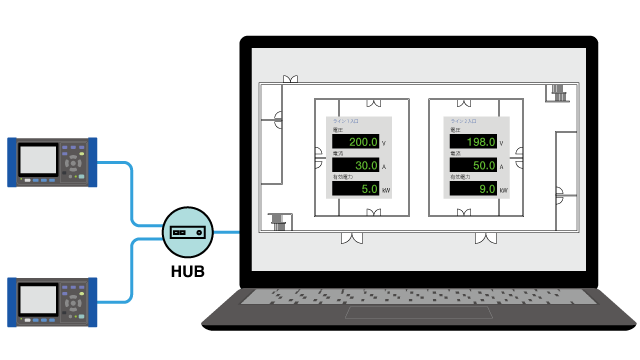
Dashboard (LAN)
- Display measured values graphically and log them.
- Automatically output CSV files and daily/weekly/monthly reports.
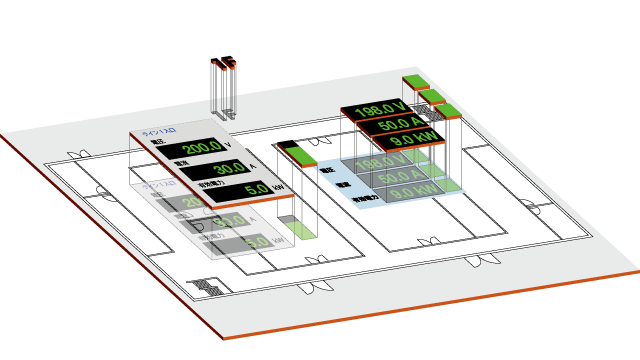
- Link measured values and measurement locations on drawings, for example when monitoring power at a plant, and display the results.
Example uses
Features
The dashboard function displays and logs measured values graphically in real time.
You can place layout elements on an image to display measured values.
Measured data is saved. You can also put data to use by outputting daily reports and CSV files.
Real-time display refresh, logging, and alarm list
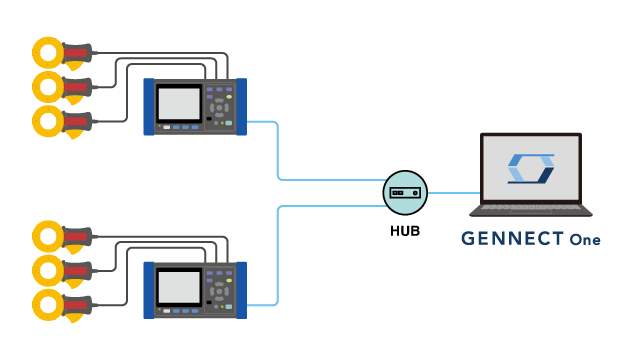
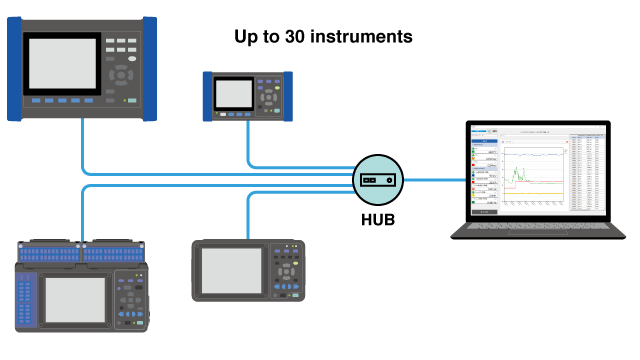
The number of instruments and measurement channels that can be connected to the dashboard function are listed below.
| No. of instrument connections | Maximum 30 |
|---|---|
| Number of measurement channels | Maximum 512 |
| Logging interval | 1 s, 2 s, 5 s, 10 s, 30 s, 1 min., 2 min., 5 min., 10 min., 30 min., 1 hr. |
Recording monitor values
The dashboard display is updated by collecting monitor values (measured values) from selected measurement channels at a set time interval.
Monitor values are also logged.
| Monitor interval | 1 s, 2 s, 5 s, 10 s, 30 s, 1 min., 2 min., 5 min., 10 min., 30 min., 1 hr. |
|---|
Alarm function
Threshold values (upper and lower limit values) can be set for each measurement parameter. If a measured value exceeds the range specified by the threshold values, the corresponding layout element will change to an alert color.
Additionally, the time and date of the alarm will be saved to a history file, along with a description of the alarm.
Creating graphics with an extensive selection of layout elements
The layout elements listed below can be placed on the dashboard.
| Element name | Description | Example element |
|---|---|---|
| Image | Images can be used as a background or placed as an element. | 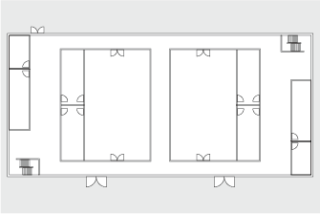 |
| Monitor windows | Monitor windows display information from an instrument. All measurement parameters from that instrument will be displayed. |  |
| Measured value level | Measured value labels display a single measurement parameter. |  |
| Measured value graphics | Measured value graphics display measurement parameters as a bar graph. You can set the upper and lower limits for the bar graph. |  |
| On/off displays | On/off displays indicate alarm status by their color. |  |
| Comment | Comments display user comments. |  |
Performs calculations using measured values. The results are logged.
Calculations are performed using measured values, and the results are logged.
Example uses
- Converting sensor input into a physical property
- Totaling energy values for individual branch circuits
| Maximum number of registered calculations | 16 formulas |
|---|---|
| Values | Measurement channels, constants |
| Four arithmetic operations | , , , , parentheses |
| Basic calculations | Absolute value, square root, cube root, exponent |
| Trigonometric functions | 、、、、、 |
| Exponent function, logarithmic function | 、、 |
| Rounding | Round up, down, or off to the specified number of digits |
Automatically outputting CSV files and daily/weekly/monthly reports
Logging values can be automatically output as a CSV file on a regular basis or output as a daily, weekly, or monthly Excel report.
Automatic CSV output
Detailed information, statistics, and measured values for all channels can be output to a CSV file on a daily or hourly basis.
| Output parameters | Description |
|---|---|
| channel information | Instrument, serial number, channel name, measurement start time, stop time |
| Statistics | Average, maximum, and minimum values for each channel from the time measured started until measurement ended |
| Measured values | All logged measured values |
| Alarms | Threshold values for each channel, number of alarms occurring per hour and alarm history for each channel |
Automatic output of daily, weekly, and monthly reports
Daily, weekly, and monthly reports are automatically output by tabulating measurement data for previously configured report parameters.
Files are output in the Excel format.
| Report parameter | Description | |
|---|---|---|
| Instrument list | List of used instruments | |
| Channel information | Detailed channel information | |
| Measurement data | List | Table created by tabulating the average, maximum, and minimum values for each channel at a set time interval* |
| Graph | Graph of the measurement data list | |
| Demand list | Table tabulating each channel, active energy by time period, electricity rate, CO2 equivalent value | |
| Alarms | List | Table tabulating the number of alarms occurring for each channel |
| Graph | Alarm list bar graph | |
| History | List of all alarms | |
Specifications
| Maximum number of instrument connections | 30 |
|---|---|
| Maximum number of measurement channels | 512 channels + 16 calculation channels |
| Logging |
|
| Logging interval | 1 s, 2 s, 5 s, 10 s, 30 s, 1 min., 2 min., 5 min., 10 min., 30 min., 1 hr. |
Monitor intervals | 1 s, 2 s, 5 s, 10 s, 30 s, 1 min., 2 min., 5 min., 10 min., 30 min., 1 hr. |
| Data segmentation | 1 day, 1 hr. |
| Maximum number of channels in graph display/list display | 32 channels |
| Chanel calculations | Calculations using a measured value from at least one measurement channel |
| Alarms | While the monitor is running, monitor values and threshold values are compared to judge whether an alarm has occurred.
|
| Layout elements | Place, edit, move, and delete graphical controls that display monitor values.
|
| Layouts | Create, save, delete, move, back up, and restore layouts; place layout elements. |
| Automatic output | Daily reports, weekly reports, monthly reports, CSV |
| instrument search | Search for and connect to instruments on the same network. |
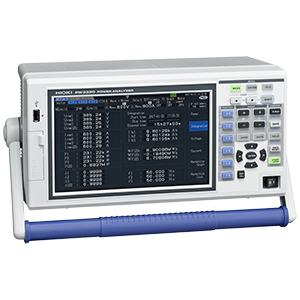
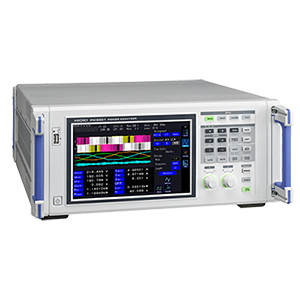
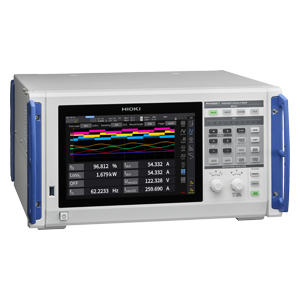
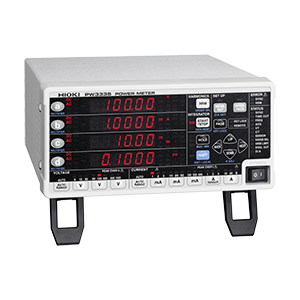
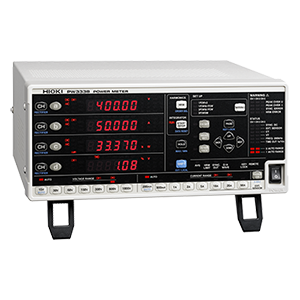
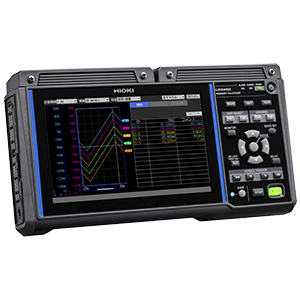
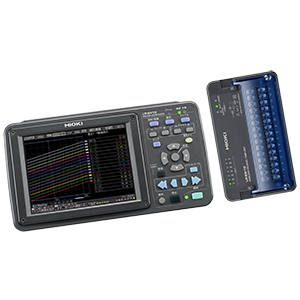
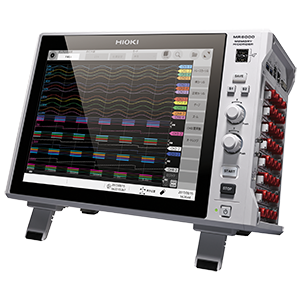
Supported instruments