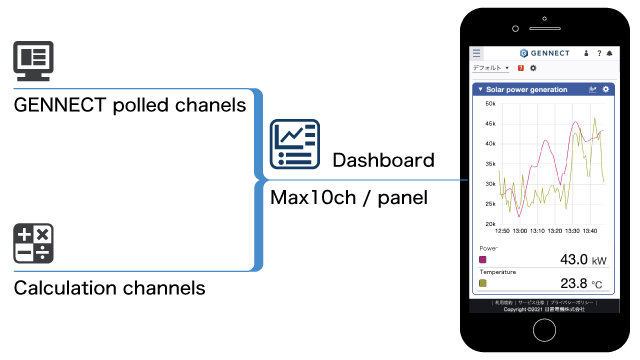
Dashboard function
The dashboard function can be used to display the latest GENNECT polled data and a time-series graph of the last hour of data on a single panel. The GENNECT polled data and time-series graph are automatically updated to reflect the most recent data.
| Number of channels |
|
|---|---|
| Maximum number of calculation channels per panel | 10 channels |
| Maximum number of panels that can be created |
|
| Display parameters |
|
Want help or have questions?