Time-series Viewer
- Display data measured by different instruments on the same time-series graph.
- Enjoy ease of use that lets you quickly view results, even when there are numerous data points.
- Search for the location you wish to view.
- Use extensive statistical analysis functions.
Features
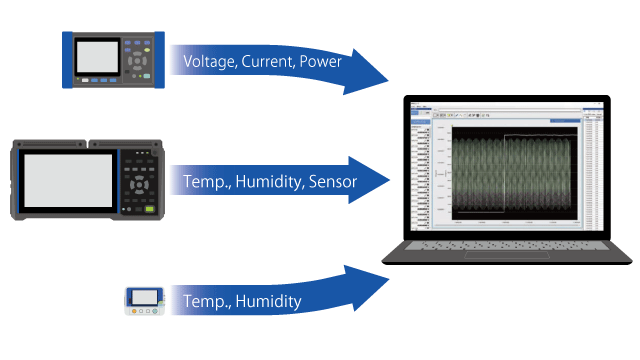
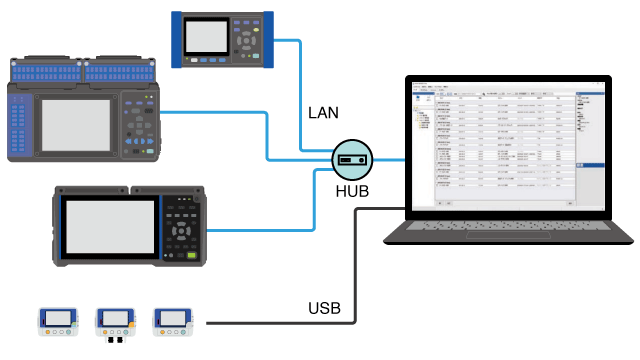
The Time-series Viewer function displays measurement files as graphs. You can aggregate measurement files from different instruments on a graph with a single time-series axis for viewing and analysis.
For example, if you’ve acquired measurement data for an air-conditioning system’s power consumption and a room’s temperature and humidity in an effort to identify the optimal settings for the system, you can use the Time-series Viewer to easily create a graph that illustrates the correlation between power consumption and temperature/humidity.
Aggregating data from different instruments
Before measurement files can be loaded into the Time-series Viewer, they must be registered in GENNECT One’s data list.
As long as the measurement files in question have been registered in the data list, files from multiple instruments can be aggregated in a single graph.
| Number of measurement parameters that can be loaded | Maximum 512 |
|---|---|
| Number of measurement parameters that can be displayed in a graph | Maximum 32 |
Data list
The following types of measurement files can be loaded from the data list:
- Measurement files automatically saved in GENNECT One by the automatic file transfer function
- Measurement files downloaded from instruments using the file acquisition (manual) function
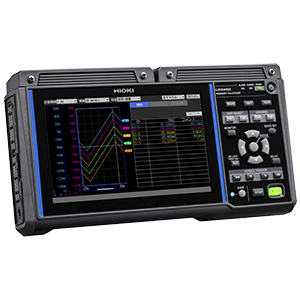
- Measurement files from the Data Mini series (of compact loggers) acquired using the LR5000 Utility
Quickly viewing the desired location
The Time-series Viewer features the ability to smoothly scroll graphs and zoom in or out, even when there are a large number of data points.
Bookmarking important areas
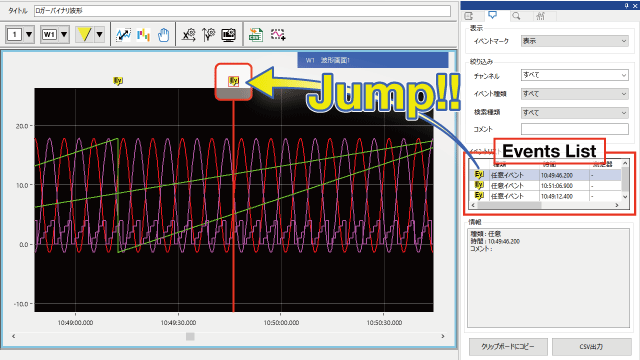
There’s functionality for adding event marks to noteworthy locations in a graph. You can also link comments to event marks and save them. Essentially, event marks serve as bookmarks.
Registered event marks are displayed in the form of the event list. By selecting an event mark on the event list, you can immediately display that waveform.
Searching for a waveform in a large amount of data
You can search a large amount of data for a set waveform pattern (search condition).
For example, you can search for the waveform where a load current reaches its maximum or minimum value, or you can search for an area where the power consumption increases rapidly.
You can also add event marks to search results. By selecting an event mark on the event list, you can immediately display that part of the waveform you’re looking for.
Extensive range of search conditions
| Search parameters | Description |
|---|---|
| Time | Search for the waveform at the specified time.  |
| Maximum position, minimum position | Search for the maximum and minimum positions.  |
| Local maximum position, local minimum position | Search for the position at which the graph changes from increasing to decreasing (the local maximum), or from decreasing to increasing (the local minimum).  |
| Level | Search for the position at which the graph crosses the set level. You can select the position at which the graph crosses from below to above the set level, or from above to below the set level.  |
| Window | Set upper and lower limit values. The area defined by those values is known as the window area. Search for the position at which the waveform enters the window area (in), and the position at which the waveform exits the window area (out). 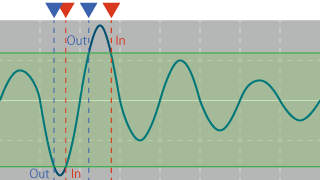 |
| Amount of change | The difference between a measured value and the next measured value (the measured value at the next sampling time) is known as the amount of change. Set a threshold value for the amount of change and then search for the position at which the waveform increases so that it is greater than or equal to that threshold value, or the position at which it falls below that threshold value.  |
Statistical analysis functions
The Time-series Viewer provides functionality for performing statistical analysis of measurement data. Statistical analysis can target the full set of data or a refined subset of the data.
| Statistical analysis parameters | Average value, peak-peak value, maximum value, maximum value time, minimum value, minimum value time, number of “on” events, on time, number of “off” events, off time, standard deviation, integration, area value, integral |
|---|
Additional functionality for data analysis and reports
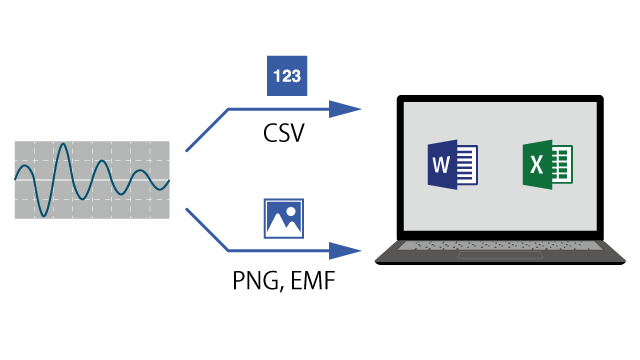
The format of graphs rendered by the Time-series Viewer can be converted so that they can be used in other software.
| CSV format output | This capability is useful when you wish to pass measurement data to Excel in order to analyze it or create a report. |
|---|---|
| Image output | In addition to saving data as an image file, you can copy it to the clipboard.
This capability lets you insert a graph image simply by pasting it into Word or Excel. |
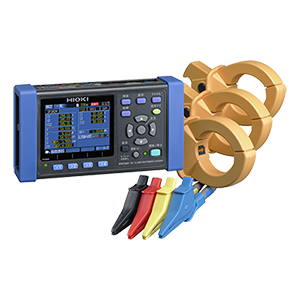
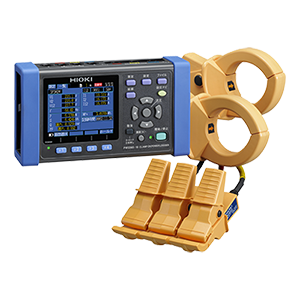
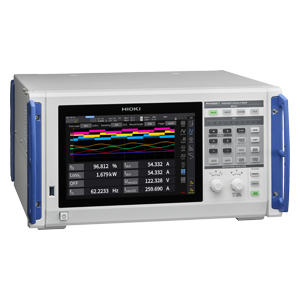
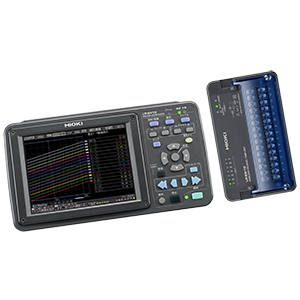
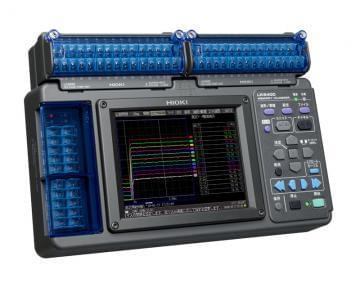
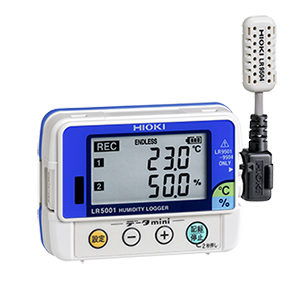
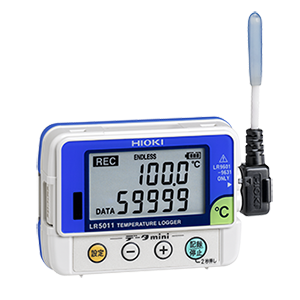
Supported instruments