Vector Measurement
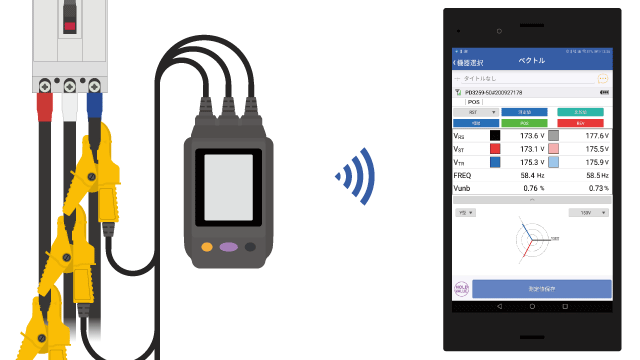
- The Digital Phase Detector PD3259-50 is a phase detector that can measure voltage without making contact with metal.
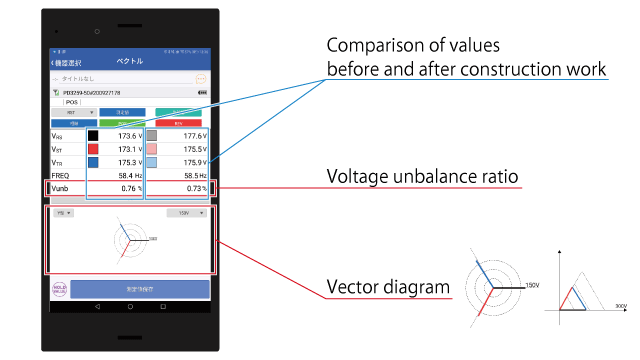
- The vector function displays the voltage measured values and phase detection results for three phases as a vector diagram.
- The ability to not only generate pass/fail judgments based on phase detection results, but also observe phase difference improves quality.
- The instrument can also measure the voltage unbalance factor.
Features
Visually check the results of the phase detector
With the vector function, the results measured by the DIGITAL PHASE DETECTOR PD3259-50 (using WIRELESS ADAPTER Z3210) can be displayed as a vector diagram for visual confirmation.
Voltage unbalance ratio and phase can also be checked
In addition to the vector diagram, the voltage unbalance ratio and phase can be checked. (These can also be checked with the general measurement and logging functions.)
The load connected to each phase of the power line may become unbalanced or unbalanced in a power supply system with a different capacity V-connection system. This can lead to uneven rotation, noise, and torque reduction in three-phase induction motors, tripping of 3E breakers, overload heating of transformers, and increased losses in capacitor-smoothing rectifiers.
A voltage unbalance ratio of approximately 3% or more is said to be highly likely to cause power quality problems.
When you want to measure the variation of the voltage unbalance ratio, you can use the logging function of GENNECT Cross to display it graphically.
The continuous operating time of the DIGITAL PHASE DETECTOR PD3259-50 is approximately 4 hours. (With LCD backlight off, wireless adapter Z3210 installed, and wireless communication in standby mode)
Compare results from before and after work and aggregate them in a report.
Measure voltage and detect phase before and after work to verify that there are no differences.
You can load the measurement results from before the work, display them alongside the current measurement results, and compare them.
Operation
Specifications
| Number of simultaneous instrument connections | 1 |
|---|---|
| Display values |
|
| Display refresh interval | Approx. 1 s |
| Phase notation | Select from RST, ABC, L1L2L3, and UVW. |
| Comparison values | Select from previously saved vector data and compare by displaying it alongside measured values. |
Supported instruments