Trend in machinery current consumption
Associated issues

- You want to know when the current consumption increases.
- Since you don’t have a data logger, you have to visually check the instrument.
Solved by GENNECT Cross!
- GENNECT Cross can graph fluctuations in current consumption in real time.
- You can ascertain the times at which maximum and minimum values occur as well as the average value.

Your field measuring instrument will become a data logger.
By using the GENNECT Cross logger function, your field measuring instrument will be transformed into a data logger.
The app will collect data at an interval as short as 1 s and display a graph in real time.
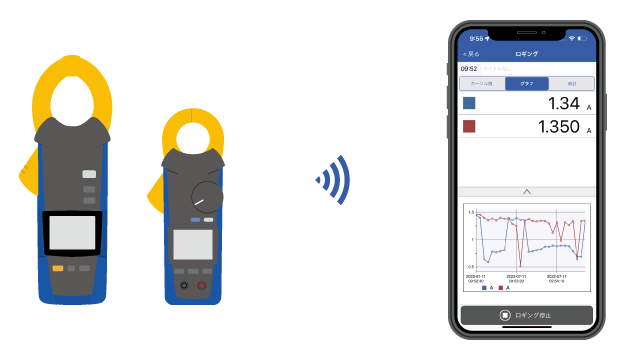
Recorded data includes the maximum and minimum current consumption values as well as the times at which those values occurred and the average value.

GENNECT Cross functions used
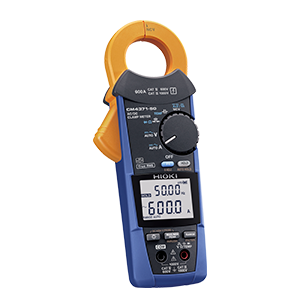
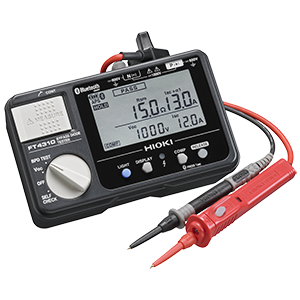
Supported instruments
支持无线适配器Z3210(选件)
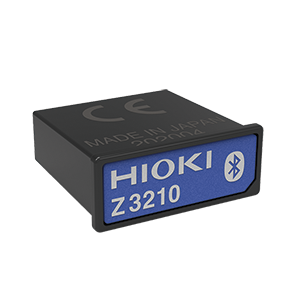
* 将无线适配器 Z3210(可选)连接到仪器上进行Bluetooth®通信。
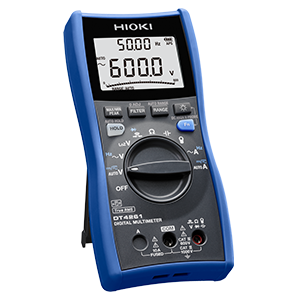
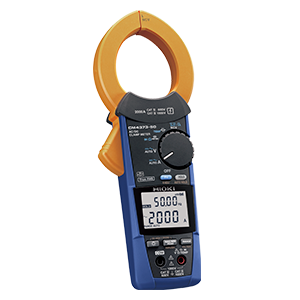


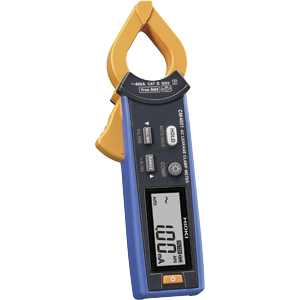

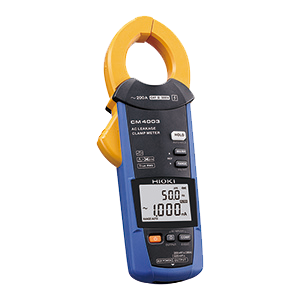
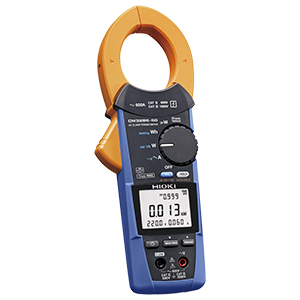

内置Bluetooth®通讯功能
想要帮助或有疑问?